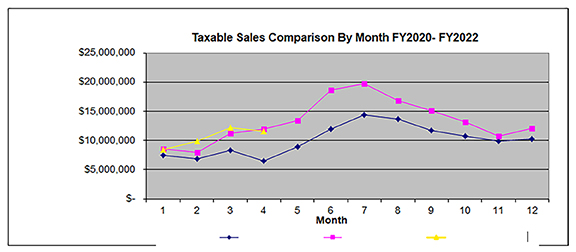
The city’s finance department has released revenue statistics for February, March and April. Vendors report and remit tax collections in the month after the close of reporting period and the city receives them the month after that.
Tax collections include “quarterly reporting” and “annual reporting” vendors and payment of previous period delinquencies, causing some distortion of monthly sales.
February’s taxable sales were 24.1 percent higher than the same month in 2021, with a total of $9,841,148 compared to $7,927,516. The “other in city” category, which includes marijuana outlets taxed at 11.4 percent, had taxable sales of $2,417,802 for the month.
February distributions
• General Fund: $555,931
• Urban Renewal Authority: $70,284
• Open Space: $8,909
• Manitou Arts, Culture, and Heritage: $26,728
• Total: $661,852
• March sales increased by 8.1 percent over those of March 2021, totaling $12,184,505 compared to $11,273,185. “Other in city” businesses brought in $3,474,964.
March distributions
• General Fund: $668,608
• URA: $157,082
• Open Space: $12,282
• MACH: $36,846
• Total: $874,817
• April sales dropped 3.8 percent from those of April 2021, totaling $11,548,738 compared to $12,008,501 in April 2021. “Other in city” businesses brought in $2,972,011.
April distributions
• General Fund: $608,809
• URA: $136,982
• Open Space: $11,598
• MACH: $34,794
• Total: $792,182

